
Spend Analysis is the systematic process of collecting, cleansing, segmenting and analysing information about the money spent through your organisation’s suppliers, with the aim of identifying the spend areas that have the biggest impact on both your organisation’s top-line and bottom-line figures.
PI Data Analytics tool helps you collect the spend data! Click here!
One starting point to assist delivering significant value to the organisation is to take a helicopter view of the company’s supplier expenditure. A top-down view of a company’s expenditure shows what is known as the entire spend on suppliers. The entire spend on suppliers can be drilled down into specific spend categories by segmenting the entire spend into supply market-facing spend areas.
The entire spend is segmented into categories in order to create groups that can be worked on individually. This enables the team handling the individual category, to manage it as if it were a business unit.
Spend Analysis Method
Few large corporations have managed to reach the point where they have a single fully integrated information system that can provide all their up-to-date spend information; and to achieve this would typically require sophisticated software interfacing with multiple systems and processes.
Most companies in the early stages of developing their spend analysis capability produce their reporting manually via excel files; or by collating multiple static reports from their in-house systems and patching the results together into a useable format.
Although there is no one single spend analysis method, one approach is to execute spend analysis in seven steps – as per the diagram below:
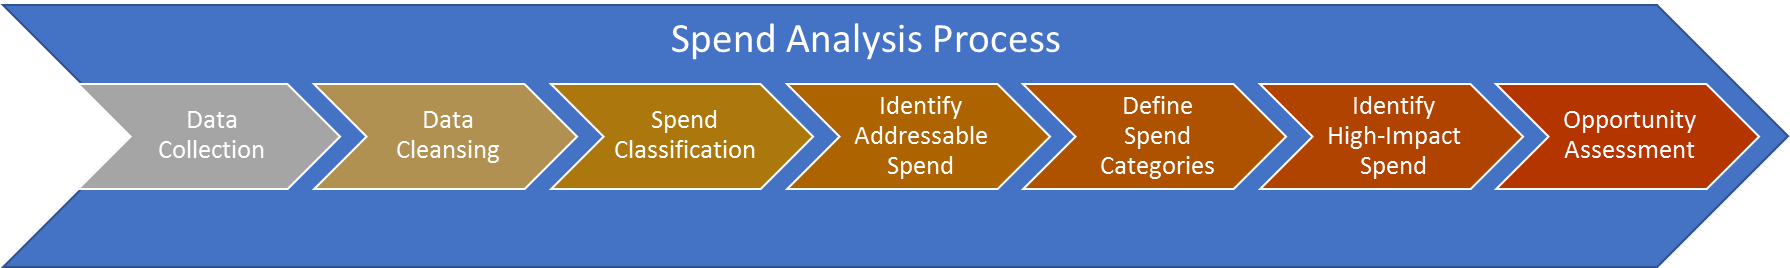
Step 1 – Collect the spend data
The first step is to collect the spend data. This data includes: items purchased over a period of time, the item description, the consumption, the prices, the related suppliers and so on.
When collecting the spend data, a company might get their data from numerous sources: ERP systems, purchasing card statements, accounting journals, supplier reports, and sales records. In many cases, data experts may be needed to extract and collate this data in a manner that allows for spend analysis to be performed.
Often the finance team can help to review invoices and purchase card information to check if the data extraction from the ERP system provides an accurate, comprehensive picture of the spend on suppliers. If nothing else, the accounting data may enrich the ERP data further.
Sales records are an interesting source for combining with historical spend data as they give a forward-looking view. This makes them beneficial for predicting future purchases and patterns in the spend profile.

Step 2 – Cleanse the spend data
Good practice is that the team executes health checks such as:
- – Checking spend totals reported vs expected
- – Comparing with the supplier records to ensure all suppliers are included
- – Grouping duplicate suppliers or supplier name variations
We may find issues such as prices not being converted with the same exchange rate, or variations in naming for the same suppliers across different data sources. When this has been corrected the team will have a cleaner data set.
The team must continue to cleanse and check the company’s entire spend data file until they have a reliable picture of the entire spend. Spend analysis software can be very helpful in this step. Algorithms to cleanse data are often integrated in such software, however not all the work can be done automatically; manual interventions will nearly always be required to cleanse the spend data.
Step 3 – Classify the spend data
Companies often purchase thousands of varying products and services from thousands of suppliers each year. To avoid having to interpret and analyse each individual purchase, they are often grouped into buckets of related purchases or spend categories. An initial step to categorisation is to classify the data – identify what is being bought. Classifying thousands of purchases in a way that aligns with the business structure, industry and procurement function can be a major challenge for any procurement team.
Linking the item data to known classification codes is one way to achieving this step. Examples of known classification codes are: North American Industry Classification System (NAICS), eCl@ss coding and the United Nations Standard Products and Services Codes (UNSPSC); however, many companies prefer to use their own company-specific set of definitions.
The UNSPSC taxonomy covers over 80,000 codes, which are updated on a regular basis. It is a hierarchical classification base with five levels, and each level has its own unique identifier.
One common error for which we must check is to ensure that the company does not classify the product or service as the supplier. Company personnel must be careful not to make the mistake of using the supplier as the classification code. The two are not the same. The outcome of this step is an enriched data file – very often an excel file – with each item and transaction linked to a unique classification code.
Spend analysis software can be of great help in this step, and it will allow for faster spend categorisation in step 5. For small enough data-sets, this step may be excluded or simply combined with the Spend Categorisation activity.
Step 4 – Detect the addressable spend
Addressable Spend refers to any purchases where the Procurement function has a direct influence on the buying process, supplier selection, contract and price negotiation etc.
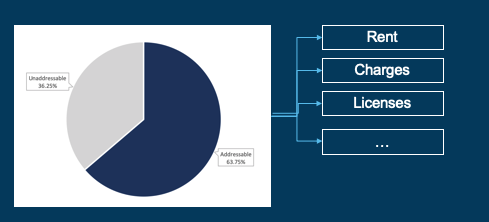
There will be a percentage of spend where it is either impossible or very difficult to influence. Some of these non-addressable spend items might include tax, rent, and governmental charges. Even if they are not of immediate interest to the procurement team for identifying cost reduction opportunities, non-addressable spend areas still have value in forming a complete picture of the organisation’s spend profile. Once the non-addressable spend have been identified and removed the addressable spend remains.
Step 5 – Define the categories
The team must segment the addressable spend into categories. The first step is to ensure that the categories reflect their supply market-facing nature, whether that is an external market (provision of client services or goods manufacture) or an internal market (business stakeholders).
The category structure should mirror how individual supply markets are organised – whether you buy a range of goods or services from similar suppliers, for example; as well as balancing sufficient granularity to understand and differentiate what goods and services are being purchased while ensuring spend is grouped into categories with large enough value to manage and extract cost benefits.
Interpretation will be needed to cluster the items into the categories, which means the data must be carefully examined. Getting this step right will dramatically influence benefits realised later in the process. In order to create categories large enough to work on, the team can combine sub-categories. Some teams also define a category tree with multiple levels, depending on the products or services they purchase.
Step 6 – Select the high impact spend
When executing this step, we might typically start by applying an ABC analysis.
The ABC analysis compares the percentage of categories with the percentage of the total spend they constitute. A common rule to follow is Pareto’s 80:20 rule, this states that an optimum situation is for 80 per cent of the entire spend to be linked to 20 per cent of the number of categories.
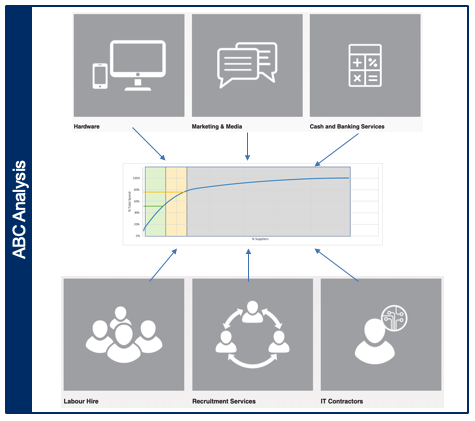
- – A Categories are the high-impact categories, those that make up 80% of the total spend
- – B Categories are still of importance, but may be considered as a lower priority to the A Categories in determining resource allocation etc. These make up the next 10% of the total spend.
- – C Categories are the categories that make up the remaining 10% of the spend. Although on their own they may not be worth investing a lot of time and effort into managing individually – there may be scope to extract ‘soft’ benefits from them, such as by reducing the time and effort required to purchase under these categories.
Differentiation between categories is necessary because not all categories require the same attention. A company may find that they have 15 high impact categories that represent 80% of their entire spend: raw materials, packaging materials, road transportation, interim labour, marketing, travel and so on.
Step 7 – Execute the opportunity scan
The seventh step simply involves executing the opportunity analysis – the output of this step is a matrix of spend categories and sub-categories, positioned by the size of their cost benefit opportunity and the ease of implementing the cost benefit strategy. The matrix defines a clear focus for extracting the maximum value from the spend profile for the least effort.
This exercise will enable the team to identify those categories that should be prioritised or avoided to spend the organisation’s resources. Each organisation should efficiently manage its resources and balance them against the potential benefits. The same applies for managing the spend categories.
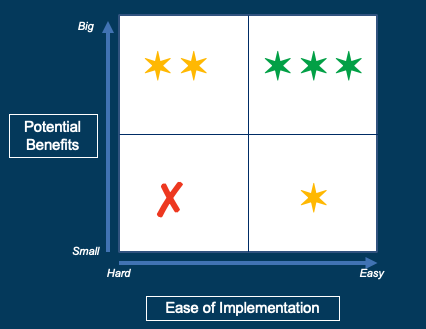
Potential benefit is plotted on the y-axis in ascending order. Potential benefits include savings obtained through a reduction in price or total cost of ownership, as well as savings from efficiency gains, reduced risk, or increased value proposition. To make estimations the team should ask questions such as:
- – How complicated is the supply market that mirrors the category?
- – Is it easy to source something within the specific supply market?
Ease of implementation is plotted on the x-axis in descending order from difficult to easy. Ease of implementation includes the ease to bring change to the organisation and the ease to realise the estimated benefits. To estimate the ease of implementation the team should ask questions like:
- – How open are stakeholders to the idea of change?
- – What is the required investment to realise the change?
- – How easy is it to switch suppliers?
The opportunity analysis can be split in a number of ways:
- – Wave plan showing successive waves of procurement activity, aligned with the benefit vs ease diagonal across the matrix (shown above). These waves might align with the successive years of executing a multi-year procurement strategy
Quadrants indicating priority activities, those that are worth the effort but may require further development in capability to extract maximum benefit; activities that may be explored depending on resource availability; and finally, activities that do not provide a worthwhile return on investment and should be avoided
Spend analysis can also be conducted on a subset of total supplier spend, subcategories within major categories or based on the internal stakeholder. Whatever portion of spend that we choose to analyse, the process for conducting the analysis remains the same.
PI Data Analytics tool helps you collect the spend data! Click here!
Get Procurement Insights That Matter
Join 10,000+ procurement professionals getting monthly expert cost-optimisation strategies and exclusive resources. Unsubscribe anytime.
JoinFollow us