PI Data Analytics SPEND CUBE
A tool to avoid inflating supply costs and gain competitive advantage
In an era of inflating supply costs finding savings and efficiencies in your supply base will help you keep spend within budget, hold down your prices, and gain the advantage over your competitors.
Using AI, machine learning and effective visualisations, PI Data Analytics’s Spend Cube (ProcureTrak™) makes sense of your spend data so you can quickly see actionable insights resulting in:
- A more efficient supply base
- Cost savings
- Improved compliance
- Reduced risk
- Improved supplier performance
- Reduced administration costs.
Once you see how effective the PI Data Analytics Spend Cube is you’ll want your suppliers to use it so the cost savings flow right down through your entire supply chain.
Download Product and Pricing Overview Now!
We’re offering ProcureTrak™ at a reduced price to people who download the product overview before 31st December 2022. Don’t miss out.
Download the Spend Cube overview now to learn more about its features, functionality, pricing, and benefits.
Who is Gaining Advantage from ProcureTrak™ ?
Major corporations, government agencies, not-for-profits, and businesses across a diverse range of industries including construction, health and education are gaining advantage from using ProcureTrak™.
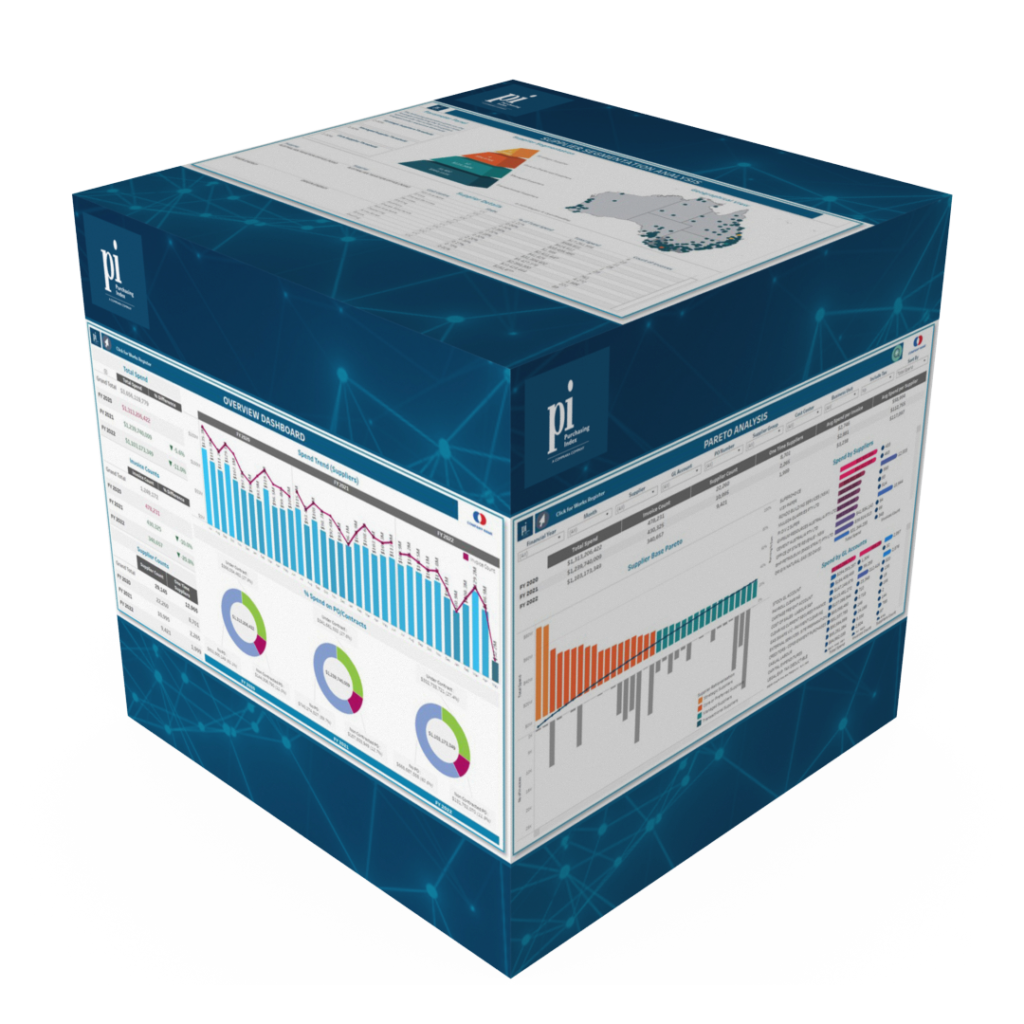
The easy-to-use spend data visualisation dashboards enable you to see actionable insights from various birds-eye views. You can then deep dive into your data to gain greater understanding at individual transaction, supplier, GL account or department level.
- Designed to be super-easy for first-time users
- All functions are intuitive and self-explanatory
- How-to guide included
- Personalized training session for your team
AI and machine learning are at the heart of this spend analysis tool allowing you to easily organise your data and gain more insights. This leads to faster evidence-based decision-making instead of data-bloated best guesses.
- Track key measures and trends
- Highlight abnormalities
- Segment suppliers
- Geographic analysis and mapping
- All charts and visualizations are interactive
- Click-to-drill functionality and a selection of filters
- Multiple functions gain visibility against all areas of expenditure
- Print all dashboards into a PowerPoint slide deck or a PDF file
- Repeatable and scalable
Highly
Customisable
Customisation of dashboards include color branding, bespoke charts, filters and layouts, and terminology to fit your organisation’s procurement dictionary.
Window to the raw underlying data.
You’ll have easy access to your original spend data without the need to go into complex queries and ERP reports to get the required information.
Easy Data
Cleansing
We can clean and consolidate messy data into a single source of truth for the dashboards.
Quickly find answers to your difficult questions
Easily identify and focus on individual questions of interest including:
- Which suppliers have relatively low spends and high volume of invoices, leading to high administration costs?
- What are the quality issues in data entry?
- Are the suppliers coded to the correct accounts?
- What are the trends on spend against one-time suppliers?
- What are the spend brackets the suppliers fall under?
- And many more …
Think. Procure. Repeat.

How to Prioritise Indirect Procurement Categories: A Data-Driven Framework
The spend analysis is done. Forty-three indirect categories, ranked by spend volume, sitting in a…

Procurement Technology Trends and AI Strategy – ProcureTECH 2026
Every year, PASA’s ProcureTECH programme acts as an unofficial barometer for what the procurement technology…

AI Spend Classification: How to Fix Tail Spend Visibility and Unlock Hidden Savings
Every tail-spend conversation eventually hits the same wall. Someone pulls a spend cube. Someone else…